
Raman Spectroscopy for Process Analytical Technology (PAT) in Pharmaceutical Manufacturing
Raman Spectroscopy for Process Analytical Technology (PAT)
Raman spectroscopy is emerging as a powerful Process Analytical Technology (PAT) tool for pharmaceutical manufacturing, enabling rapid, non-destructive, and real-time monitoring of critical quality attributes throughout the production process. Its molecular fingerprinting capability allows direct assessment of raw materials, intermediates, and finished products, while providing valuable information on chemical composition, concentration, polymorphic form, crystallinity, and process-related changes. Raman-based PAT can support continuous process monitoring, reduce dependence on time-consuming laboratory analysis, and facilitate early detection of process deviations. When integrated with chemometric and multivariate data analysis, Raman spectroscopy provides actionable insights for process understanding, control, and optimization, thereby supporting consistent product quality and more efficient pharmaceutical manufacturing.
What is PAT and Why Raman is a preferred choice for PAT?
Process Analytical Technology (PAT) is a science- and risk-based approach for monitoring and controlling pharmaceutical manufacturing processes in real time to ensure consistent product quality. Raman spectroscopy is a preferred PAT tool because it provides rapid, non-destructive, molecular-specific analysis with minimal sample preparation. It can be integrated through in-line, on-line, or at-line configurations to monitor raw materials, intermediates, and finished products, while tracking critical quality attributes such as composition, concentration, polymorphic form, and process changes. Raman spectroscopy is particularly suitable as a PAT tool for Esterification because it provides molecular-level information based on vibrational transitions, allowing differentiation of reactants (alcohol, acid), products (ester), and by-products (e.g., water, methanol). It has weak interference from water, which is advantageous since water is often a by-product in Esterification. It can be implemented in-line or on-line using fibre-optic probes directly in the reactor, enabling continuous, non-destructive monitoring.
In this study, TechnoS Instruments monitored the Esterification process in-line using the IndiRAM™ Portable Raman spectrometer.
Materials and Methods:
In-line reaction monitoring: Raman spectra were acquired using an IndiRAM Portable Raman Spectrometer, TechnoS Instruments Ltd., Jaipur, India. Fibre-optic Raman probes are inserted into batch or flow reactors to acquire spectra throughout the reaction. A laser excitation source of 785 nm emission wavelength was used with 300 mW power. A total of 500 scans were acquired with an integration time of 1.25 sec per scan and a 1 sec interval between consecutive scans. The reactants are acetic acid (CH₃COOH) and ethanol (CH₃CH₂OH).
Reaction equation
CH3COOH + CH₃CH₂OH ⇌ CH3COOCH₂CH₃ + H₂O
Reaction conditions:
Acid catalyst: usually concentrated sulfuric acid (H₂SO₄) or dry HCl gas.
Heat: reflux is commonly used to increase the rate.
The reaction is reversible: to drive it toward ester formation, one can use excess ethanol or remove water (e.g., using a Dean–Stark apparatus or molecular sieves).
Results & Discussion
Figure 1 (a,b,c) shows the Raman spectra of the reactant, the reaction and the product, respectively. Raman peak of the reactant
| 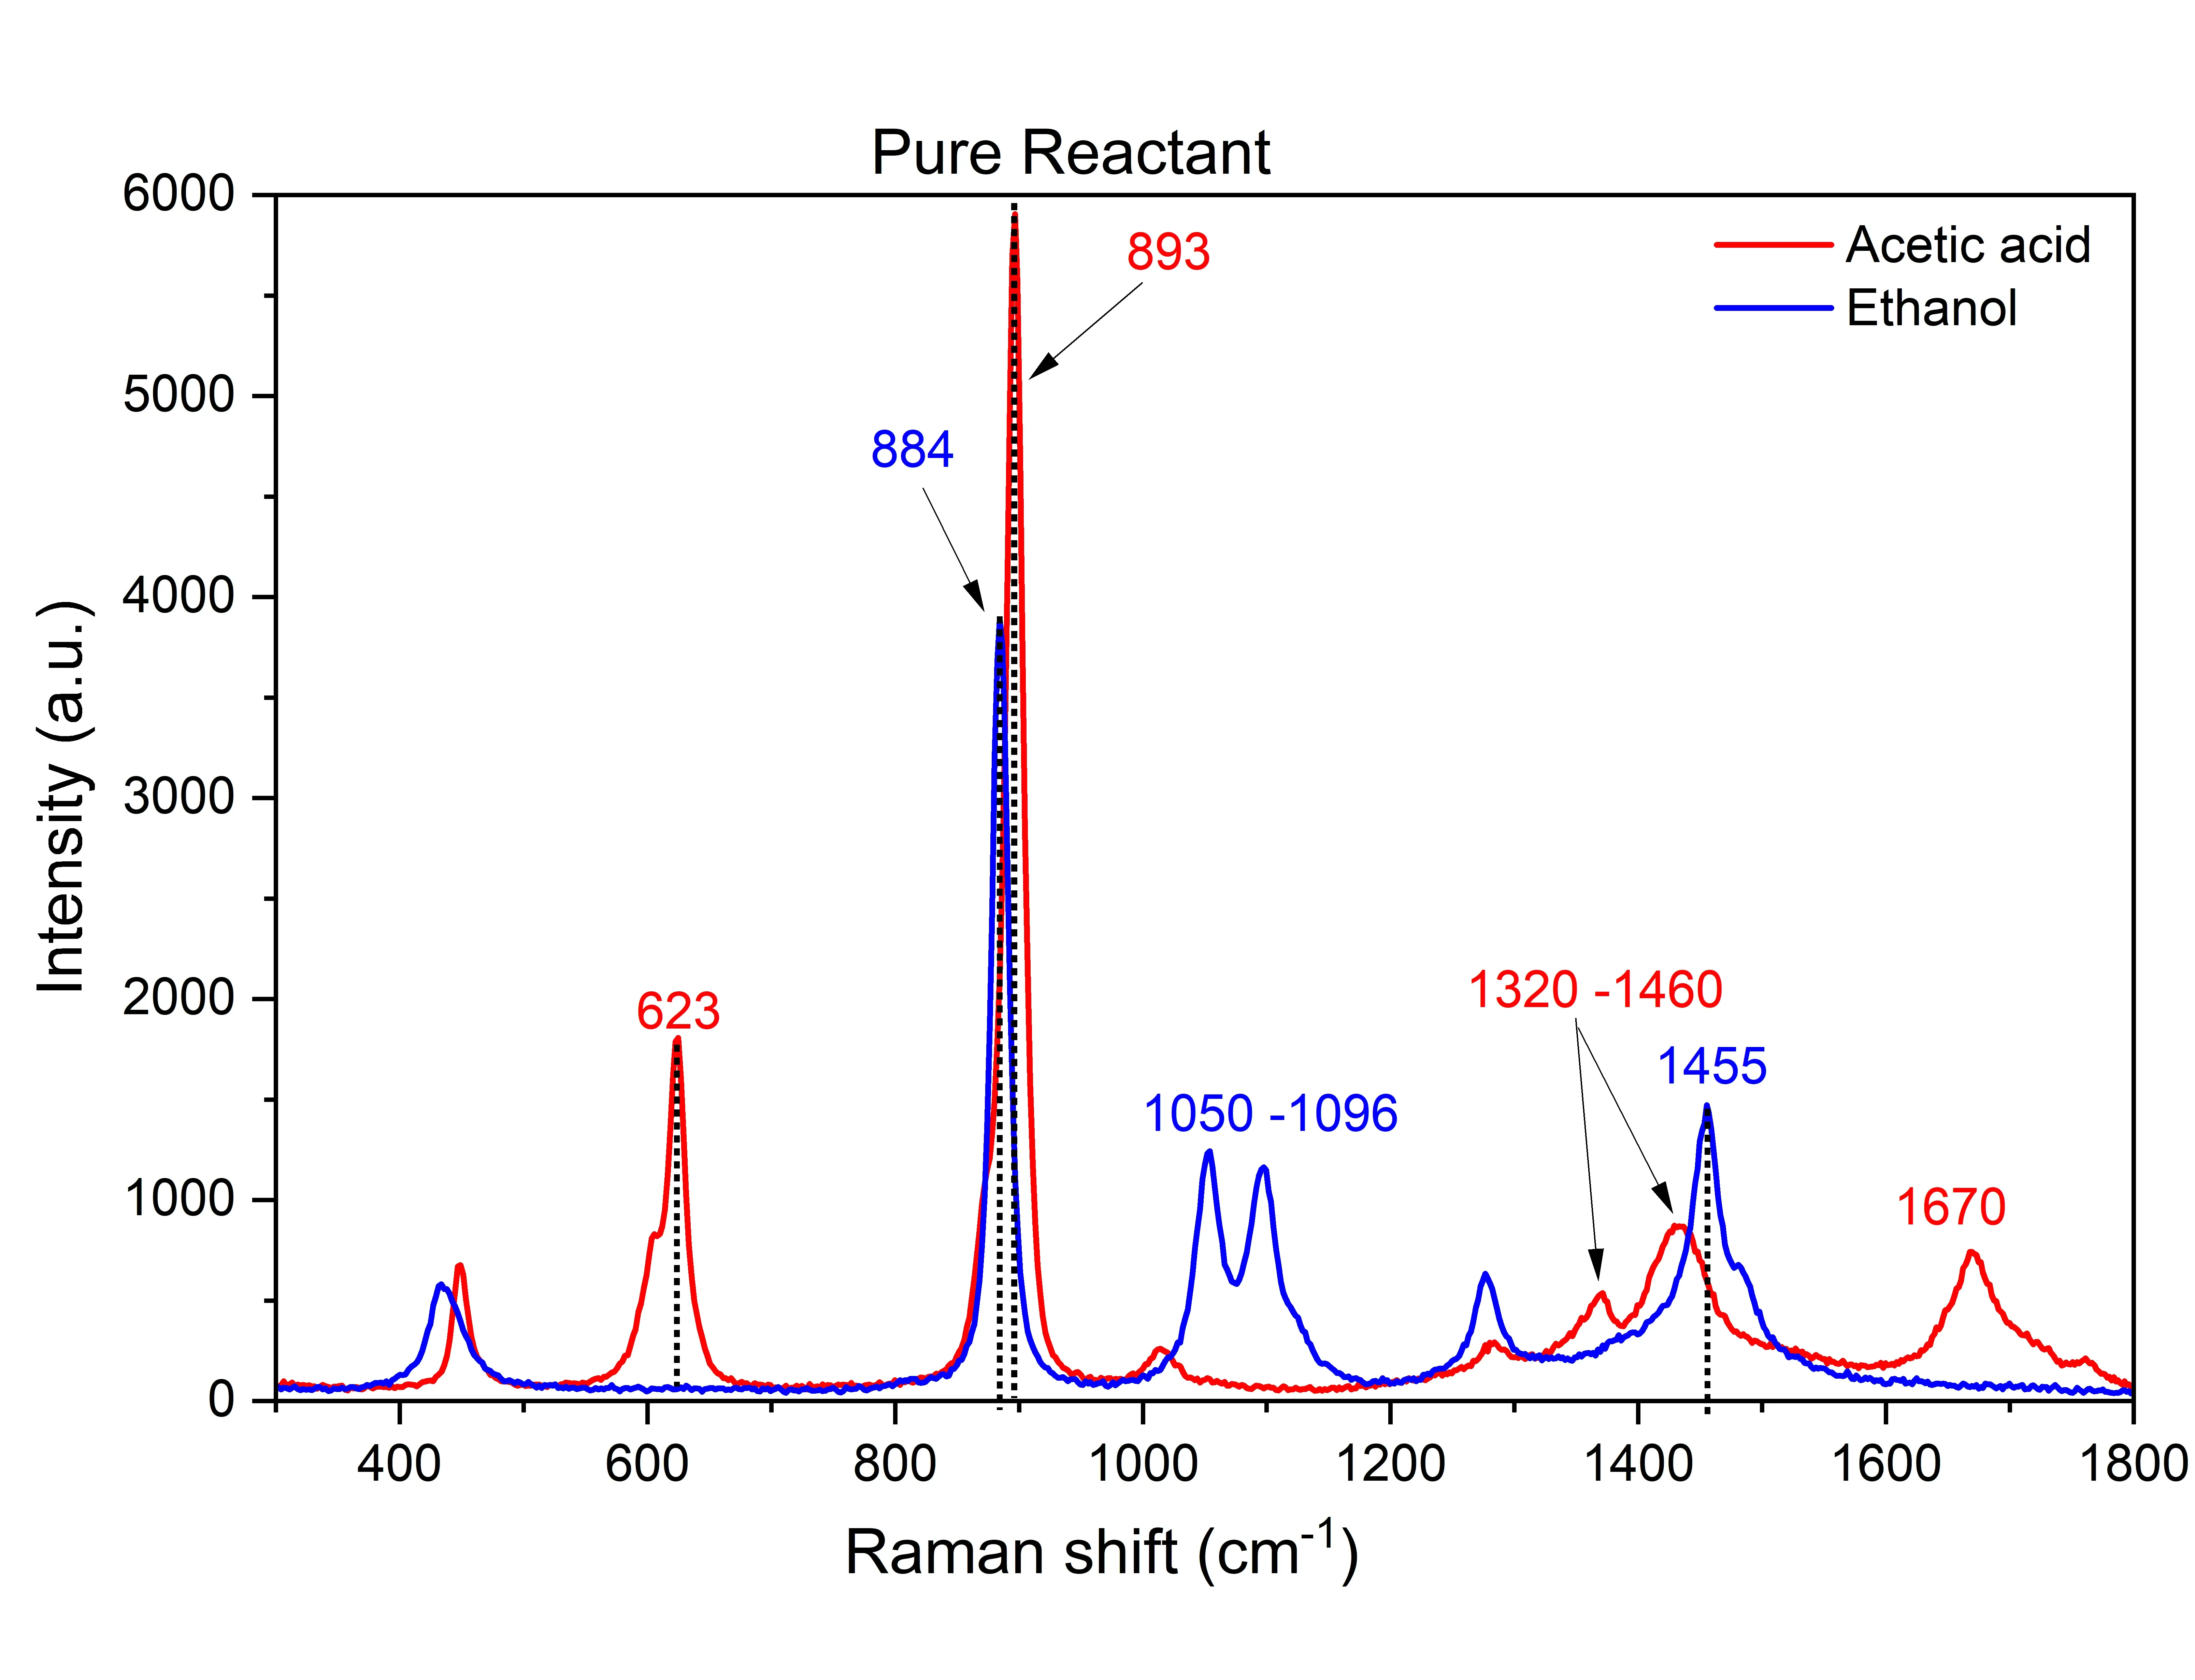 Figure 1a: Raman spectra of pure reactant |
Real-Time Process Monitoring (PAT)
Each Raman spectrum is collected after 1 sec. The representative Raman spectra are shown below: ~1 sec, 50 sec, 100 sec, 150 sec, and 200 sec. The conversion point is observed at ~200 sec.
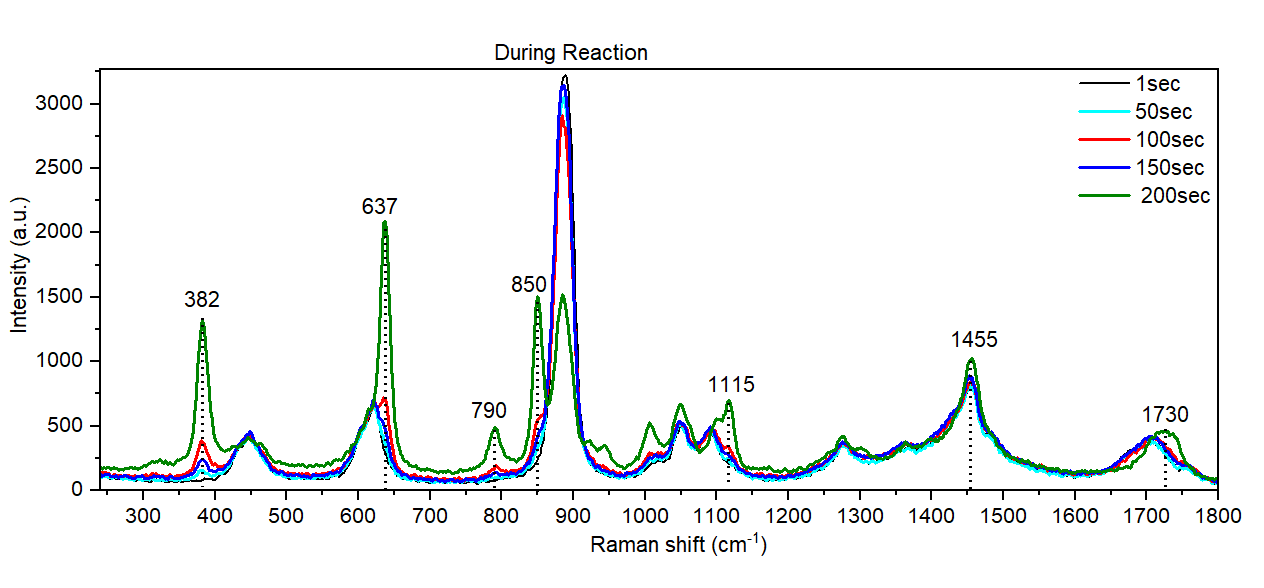
Figure 1b: Monitored during Reaction
Raman peak of Product
Ethyl acetate: CH₃COOCH₂CH₃
Characteristic Raman bands are tracked, such as:
| 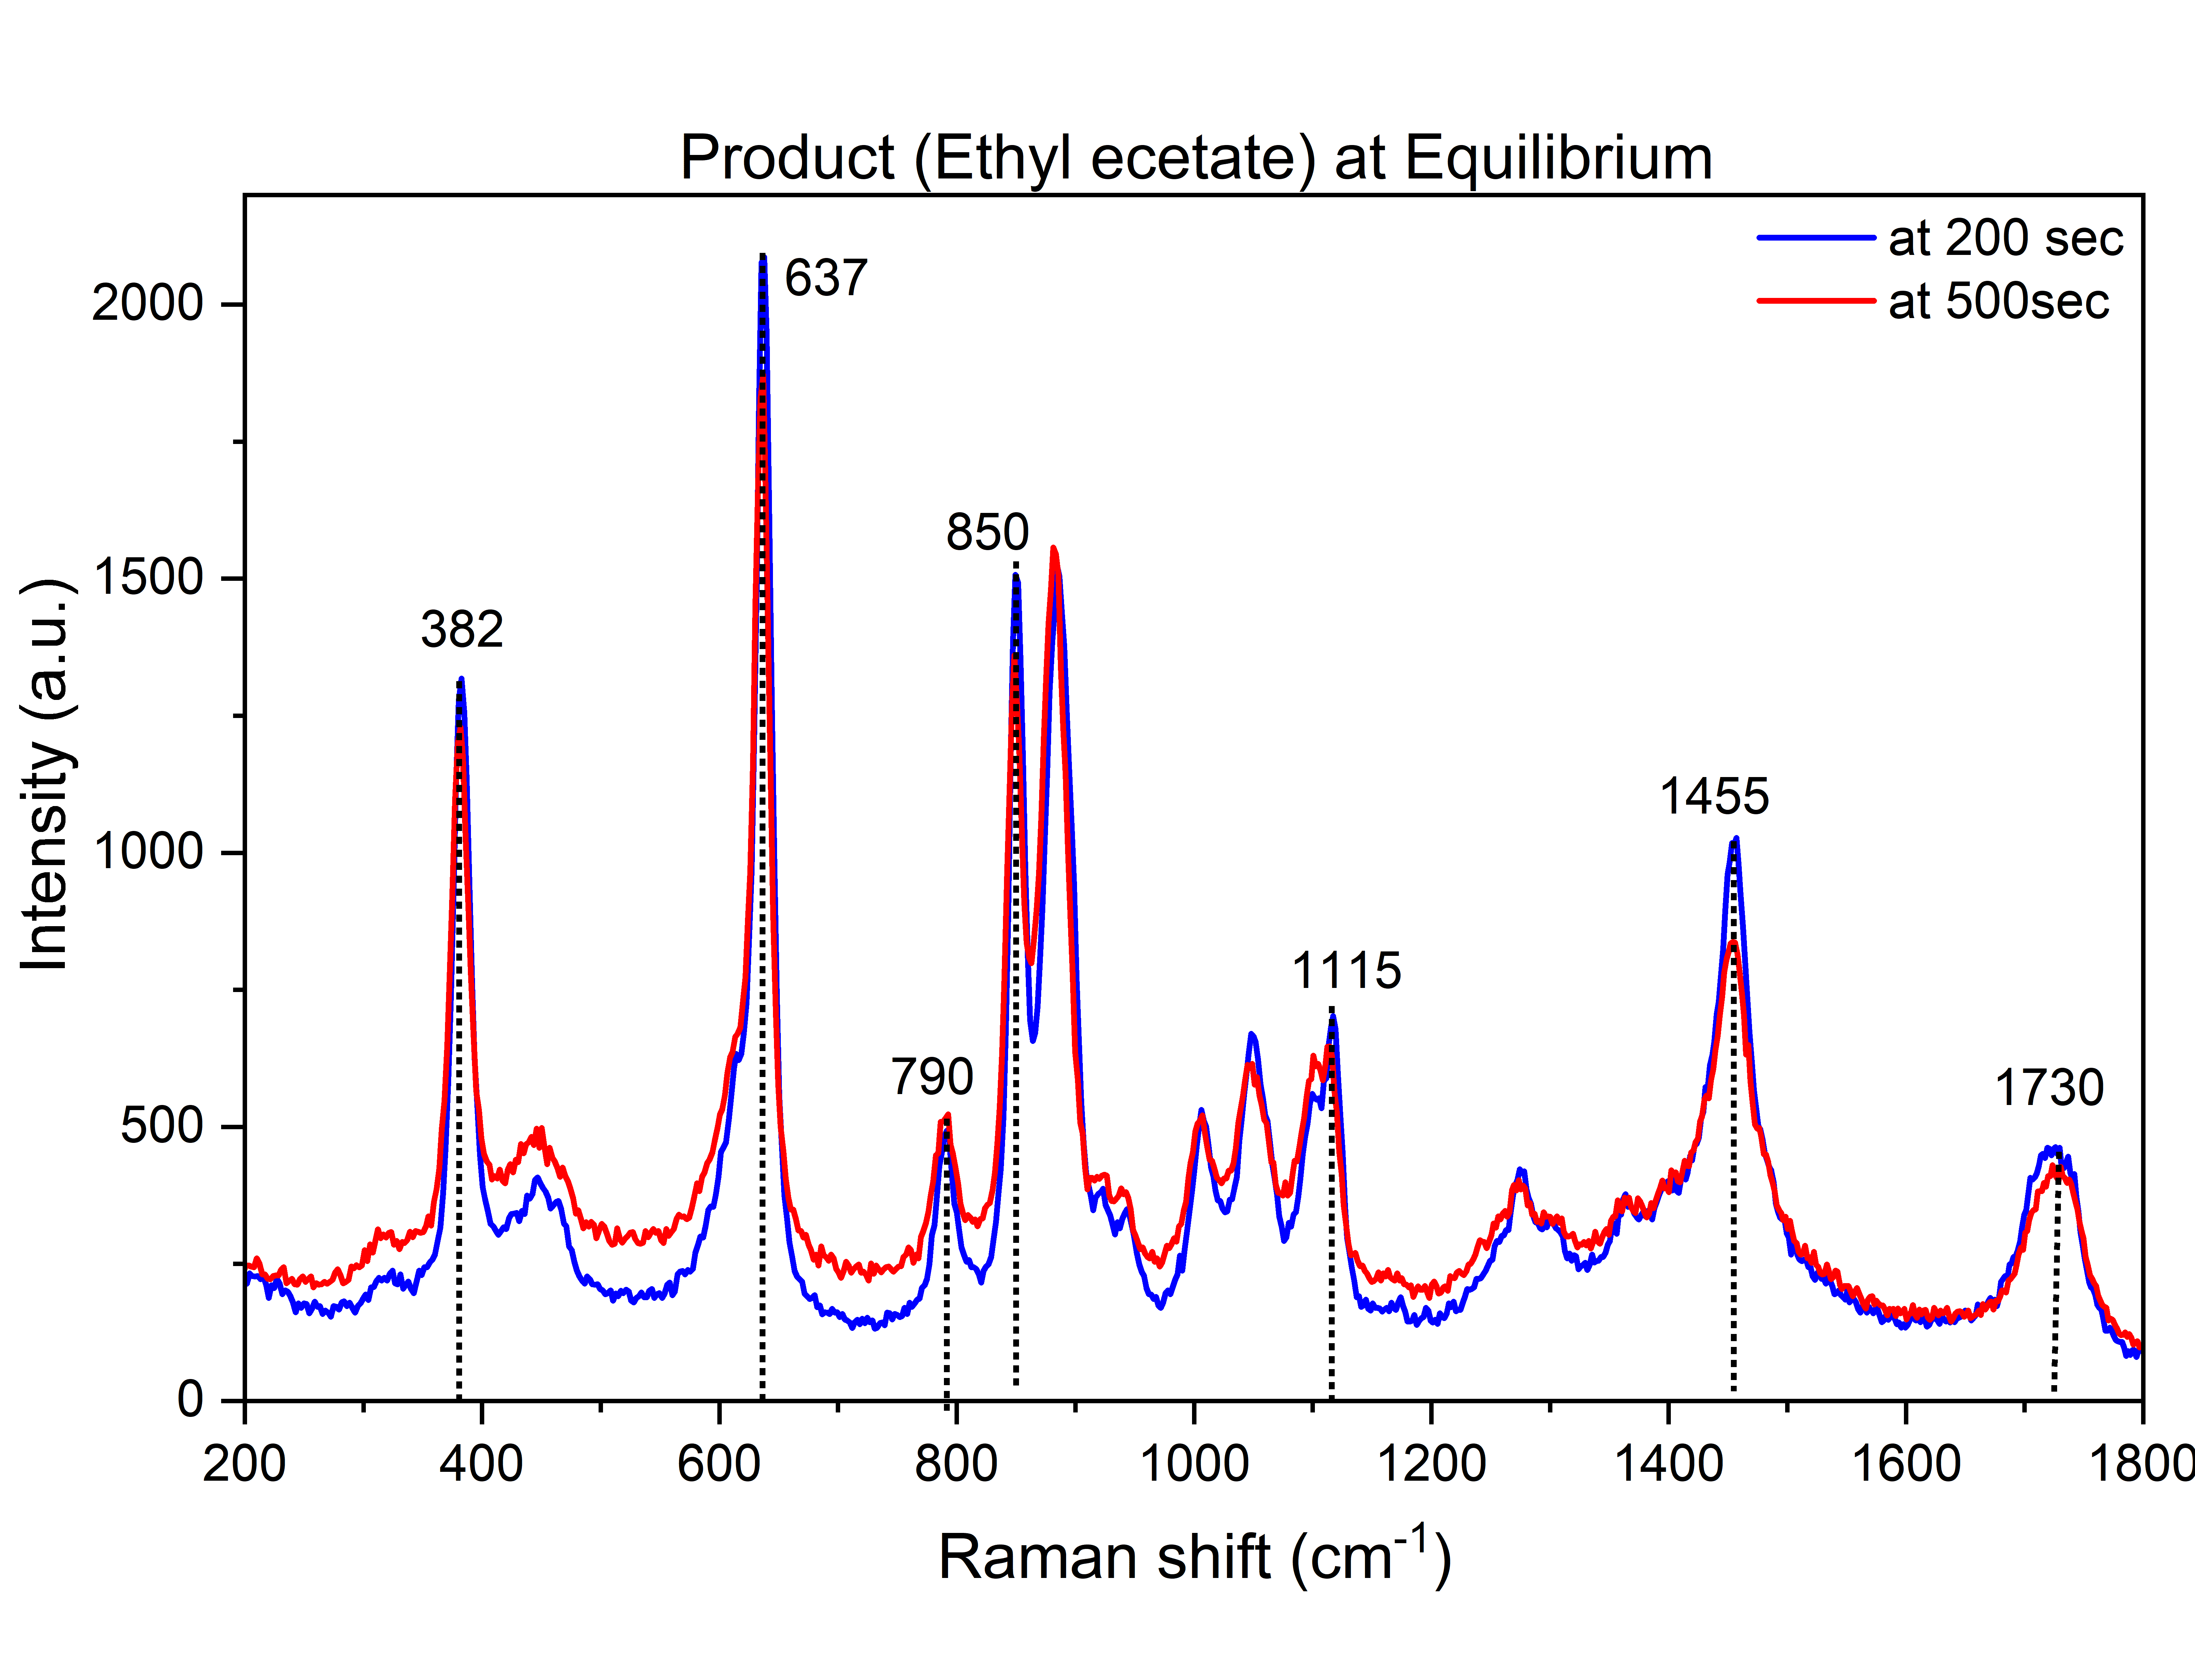 Figure 1c: Raman spectra of Product |
Conclusion
In this application note, these models show real-time Estimation of conversion at 200sec. Raman spectroscopy provides molecular-level information with minimal sample preparation, making it well-suited for in-line and on-line process monitoring. Raman spectroscopy offers pharmaceutical manufacturers a powerful pathway to achieve faster, smarter, and more efficient process control. By enabling real-time, non-destructive monitoring with minimal sample preparation, Raman-based PAT can reduce reliance on time-consuming laboratory testing, minimize process variability, detect deviations early, and support consistent product quality. Its integration with chemometrics and automated process control can further improve manufacturing efficiency, reduce material and production losses, and accelerate decision-making. Ultimately, Raman PAT helps manufacturers strengthen quality assurance while driving greater productivity, operational efficiency, and cost-effectiveness across pharmaceutical manufacturing.
Reference -
Christos Pappas et al., 1st International Multidisciplinary Conference on Nutraceuticals and Functional Foods, Current Research in Nutrition and Food Science Vol. 4(SI. 2), 2016.
Olof Svensson, Mats Josefson, Frans W. Langkilde, Chemometrics and Intelligent Laboratory Systems 49, 1999. 49–66.