Raman Spectrometer Components
How to choose a Raman Spectrometer Components
5 Raman Spectrometer Components That Determine Your Results
Choosing the right configuration for a Raman spectrometer isn’t a plug and play decision. Each application places its own demands on performance, sensitivity, and usability. A system designed for pharmaceutical quality control will differ significantly from one used in semiconductor thin-film analysis or field-based forensic work. Even a single mismatched component can compromise results - leading to weak signal intensity, excessive fluorescence interference, or an inability to detect low-concentration analytes.
In Previous Article, we covered the Principal of Raman spectroscopy and the role of each core component. Now, this guide takes a practical approach. We break down the 5 essential components of a Raman spectrometer, outlining what to consider, the key trade-offs involved, and how different configurations align with specific use cases.
Whether you’re comparing commercial solutions like portable or handheld Raman Spectrometers or planning a custom-built system, this guide is designed to help you make a confident, well-informed decision.
Component 1:
Best laser Wavelength for Raman Spectroscopy
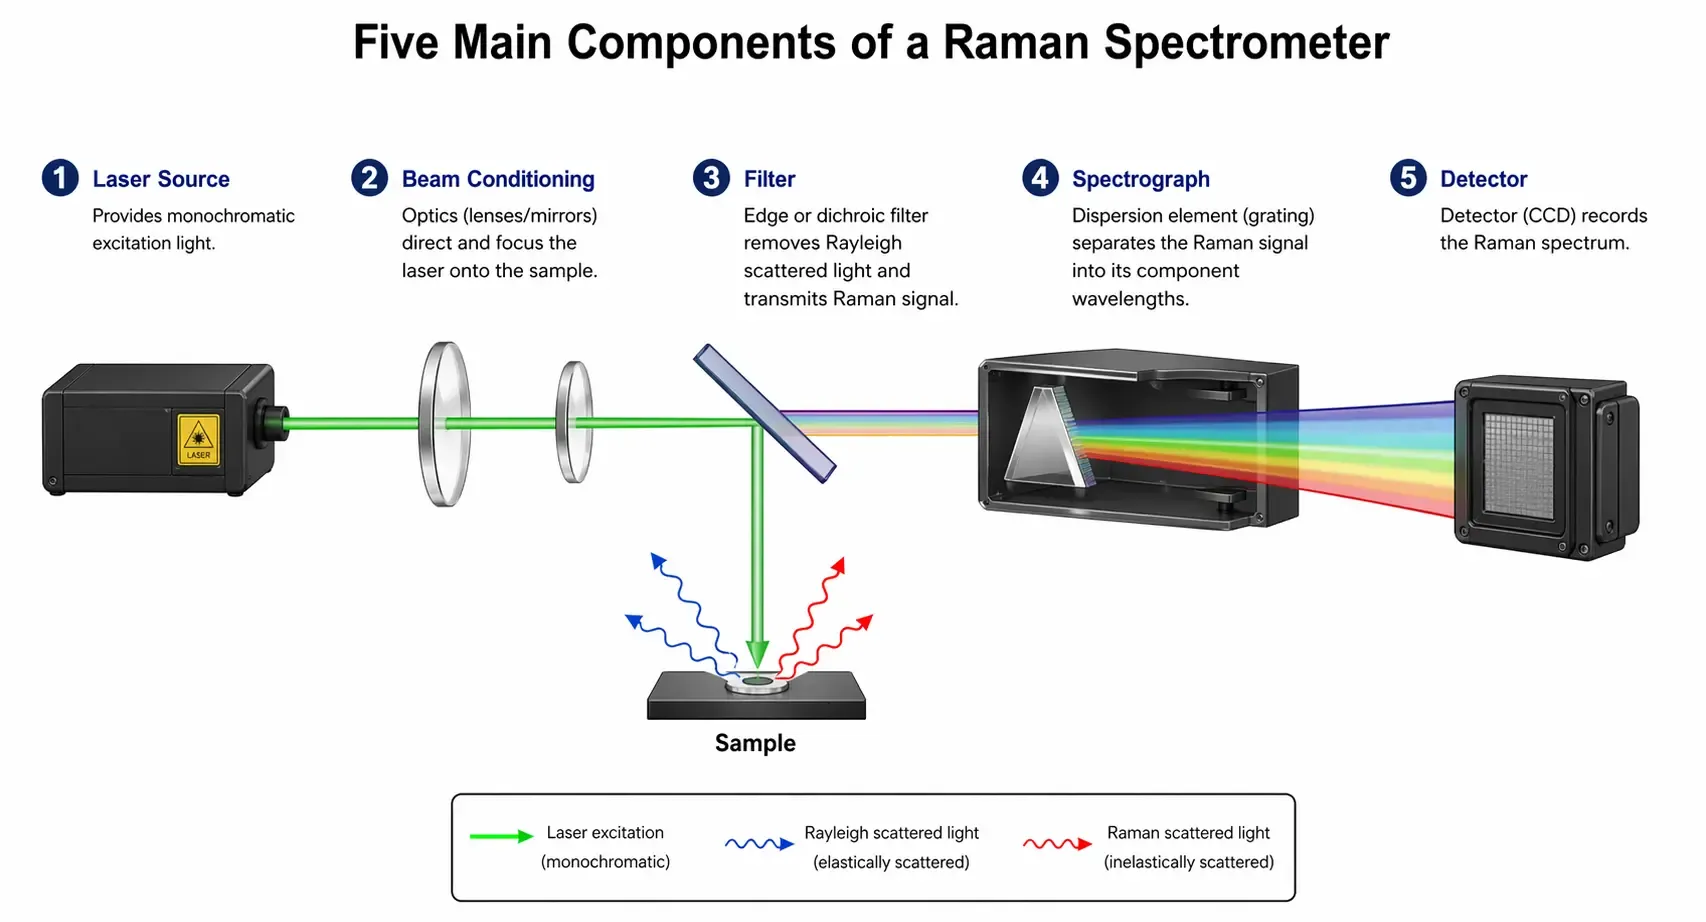
The excitation laser is the single most consequential component in any Raman system. Its wavelength governs three critical trade-offs: Raman scattering intensity, fluorescence background, and detector compatibility. Selecting the wrong wavelength can render an otherwise well-built system unusable for your samples - highlighting why choosing the Best Raman Spectrometer for your application is essential.
Key selection factors:
- Sample type: organic, inorganic, biological, or polymeric
- Fluorescence sensitivity of the sample at the excitation wavelength
- Required Raman scattering intensity (inversely proportional to λ⁴)
- Available detector technology for the chosen wavelength range
- Application environment: lab, portable, or in-line process
| Wavelength | Advantages | Limitations | Best For |
|---|---|---|---|
| 320 nm (UV) | Resonance enhancement for conjugated molecules | Photodegradation, strong fluorescence | UV-resonance Raman, SERS, thin-film analysis |
| 355 nm (UV) | Similar UV benefits with slightly reduced damage | Fluorescence background, heating | Surface science, polymer coatings |
| 457 nm | High Raman cross-section | Moderate fluorescence in organics | Biomedical research, semiconductor materials |
| 488 nm | Strong Raman signal | Fluorescence in coloured samples | Inorganics, crystal polymorphism studies |
| 532 nm | Very high Raman intensity | Intense fluorescence in biological samples | Clear crystals, inorganic compounds |
| 633 nm | Lower fluorescence vs. green lasers | Weaker scattering than 532 nm | Biological samples, pigment and dye analysis |
| 785 nm | Low background fluorescence | Slightly weaker Raman signal | General-purpose Raman, biomaterials, pharmaceuticals |
| 830 nm | Further reduced fluorescence vs. 785 nm | Requires high-sensitivity detectors | Fluorescent samples, drug formulations |
| 1064 nm | Minimal fluorescence | Costly InGaAs detection | Forensic analysis, fluorescent organics |
If you are configuring a general-purpose system and cannot pre-screen your samples, start with 785 nm. It offers the best practical balance of fluorescence suppression, signal strength, and detector affordability.
For heavily fluorescent biological or organic samples, step up to 1064 nm with an InGaAs detector.
Component 2:
Sample Illumination and Collection Optics
Collection optics determine how laser light reaches your sample and how efficiently Raman-scattered photons are collected back into the spectrometer. This directly affects both spatial resolution and signal throughput - two parameters that often pull in opposite directions.
Key Selection Factors:
- Required spatial resolution: sub-micron mapping vs. bulk analysis.
- Sample accessibility: lab bench, process line, or remote/field location.
- Working distance requirements (e.g., non-contact analysis of fragile samples).
- Portability and form factor constraints.
| Configuration | Spatial Resolution | Best Use Case | Limitations |
|---|---|---|---|
| Microscope Objective (50×–100×) | Sub-micron (< 1 µm) | Micro-Raman mapping, semiconductor thin films, biological cells | Requires precise sample positioning; short working distance |
| Microscope Objective (10×–20×) | 1–10 µm | Bulk material characterization, polymer films, mineralogy | Lower resolution than high-mag objectives |
| Fibre-Optic Probe | 100 µm–1 mm (probe-dependent) | In-field or in-line industrial QC, remote sensing, process monitoring | Lower spatial resolution; coupling losses reduce signal |
| Free-Space Optics | Variable (alignment-dependent) | High-precision lab setups requiring custom optical paths | Sensitive to vibration and misalignment |
Component 3:
Laser Rejection Filters (Edge / Notch/UNF)
Raman scattering is inherently weak - the Rayleigh-scattered laser light returning from the sample is typically 10⁶ to 10⁸ times more intense than the Raman signal. Without a high-quality filter to reject this laser line, the Raman spectrum is completely buried. Filter selection must be matched precisely to your laser wavelength.
Key selection factors:
- Your laser wavelength (filter cut-off must match)
- Whether you need Stokes-only or both Stokes + Anti-Stokes detection
- Minimum Raman shift of interest (edge filters lose signal below ~100 cm⁻¹)
- Budget: notch filters are generally more expensive than edge filters (Pro Tips
| Filter Type | Mechanism | When to Choose It | Key Limitation |
|---|---|---|---|
| Edge Filter (Long-pass) | Blocks Rayleigh line on one side | Standard Stokes Raman measurements; most lab and field applications | Cannot collect Anti-Stokes signal; cuts off very low Raman shifts (< ~100 cm⁻¹) |
| Notch Filter (Band-stop) | Blocks narrow band around laser line | When both Stokes and Anti-Stokes detection needed (thermometry, stress analysis) | Slightly lower laser rejection than edge filters; more expensive |
| Ultra-Notch Filter (UNF) | Very narrow rejection band for ultra-low Raman shifts | Ultra-low frequency Raman (< 50 cm⁻¹), advanced material studies | More complex and costly; requires precise alignment |
Component 4:
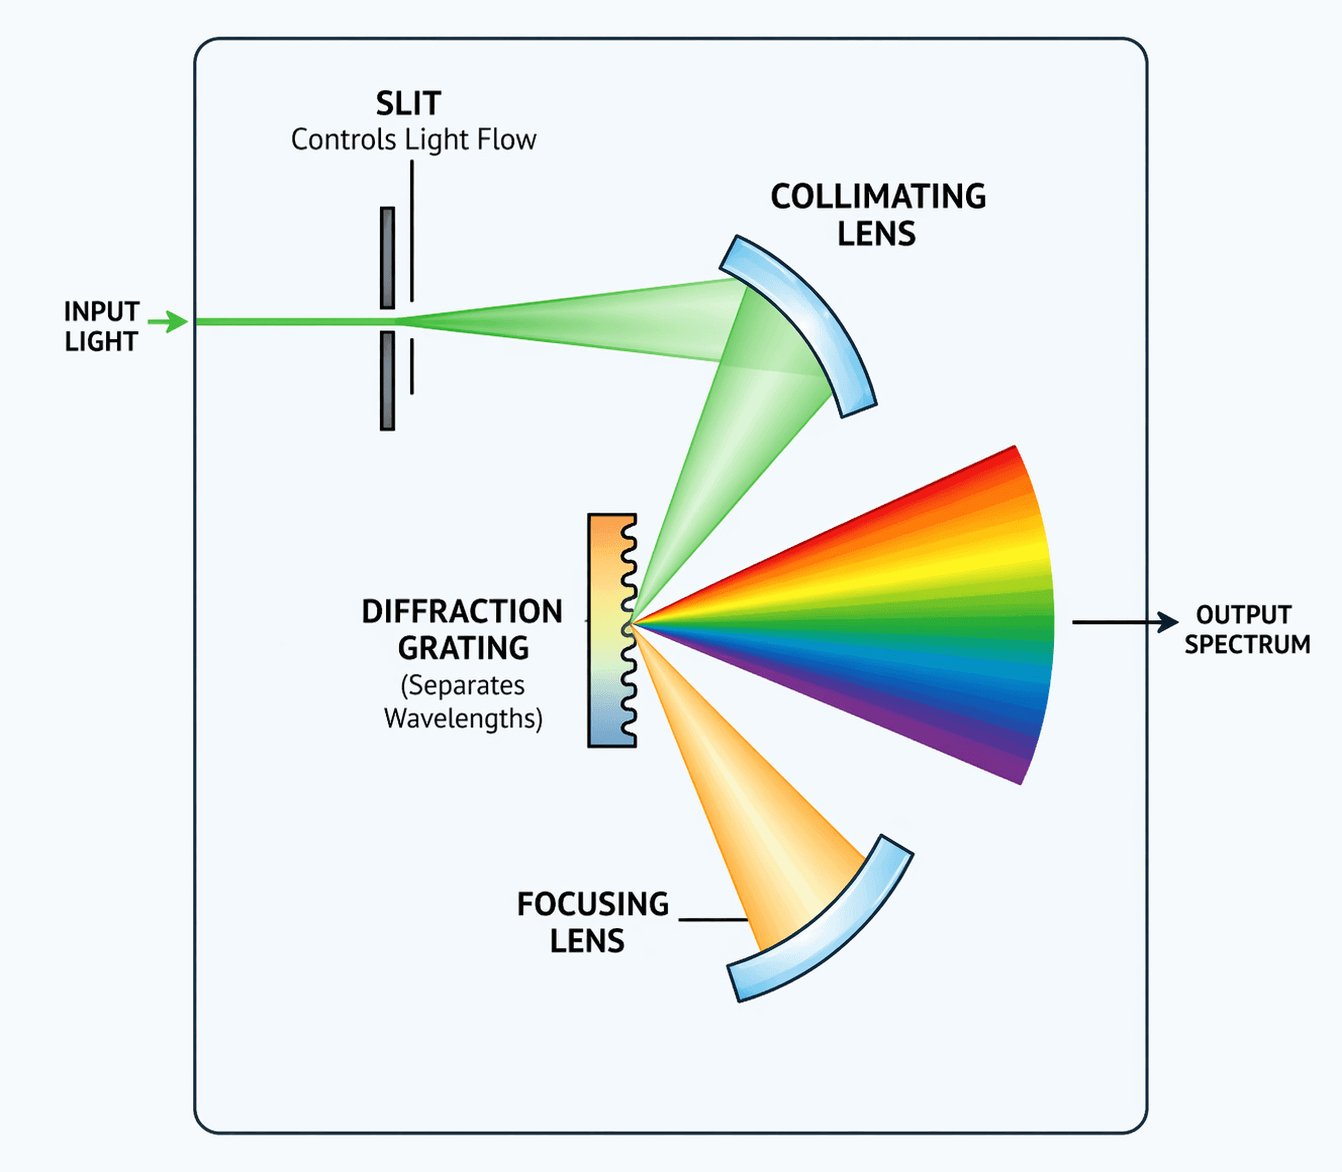
Dispersive Element - Grating or Monochromator
The diffraction grating disperses Raman-scattered light by wavelength across the detector array. Its groove density directly determines spectral resolution and the width of the spectral window captured in a single acquisition. Choosing the right grating involves balancing resolution against spectral range - you generally cannot maximize both simultaneously. Key selection factors:
|  |
| Grating Option | Groove Density | Spectral Resolution | Best For |
|---|---|---|---|
| Low-density fixed grating | 150–300–600 lines/mm | Low (~>6 cm⁻¹); wide spectral window | Survey scans, broad-range screening, portable systems |
| Standard fixed grating | 1200 lines/mm | Moderate (~2–5 cm⁻¹); balanced throughput | Routine lab Raman, pharmaceutical QC, general analysis |
| High-density fixed grating | 1800–2400 lines/mm | High (< 1 cm⁻¹); narrow spectral window | Crystal phonon modes, stress/strain analysis, semiconductor characterization |
| Motorized / Monochromator | Tunable (300–1800+ lines/mm) | User-selectable; scan full spectrum in steps | Research-grade systems requiring flexible spectral coverage |
Component 5:
Si CCD vs. InGaAs Detector: A Practical Comparison
The detector converts dispersed photons into an electronic signal. In Raman spectroscopy, where signal intensity is intrinsically low, detector selection has an outsized impact on system sensitivity, dynamic range, and usable spectral range. Cooling the detector is not optional in most quantitative or trace-level applications - uncooled detectors generate excessive dark noise that limits detection..
Key selection factors:
- Spectral range compatibility with your laser wavelength
- Quantum efficiency at your Raman wavelength range
- Dark noise level - strongly affected by whether the detector is cooled
- Dynamic range requirements for your concentration range
- Budget: back-thinned and InGaAs detectors carry a significant cost premium
| Detector Type | Wavelength Range | Quantum Efficiency | Cooling Method | Best Applications |
|---|---|---|---|---|
| Standard CCD | 400–900 nm | Up to ~65% | Thermoelectric (TE) | Visible-laser Raman (405, 532, 633, 785 nm); general lab use |
| Back-thinned CCD | 200–1100 nm | Up to ~95% | Thermoelectric or LN₂ | Weak Raman scatterers, low-concentration samples, high-sensitivity research |
| InGaAs Array | 900–1700 nm | ~80% at 1000–1600 nm | Thermoelectric | 1064 nm excitation; IR Raman; highly fluorescent organics |
| CMOS | 400–700 nm | ~50–70% | None (room temp) | Low-cost portable/handheld systems; educational kits |
Application-Based Recommendations
The following table consolidates the optimal component combination for nine common Raman spectroscopy applications. Use it as a starting point - your specific Raman sample properties, throughput requirements, and budget may justify adjustments.
Raman Spectrometer Component Selection by Application
| Application | Laser Source | Collection Optics | Filter Type | Dispersive Element |
|---|---|---|---|---|
| Pharmaceutical Quality Control | 785 nm, 50–100 mW | Fiber-optic probe or 10×–20× objective | Edge filter (785 nm) | 1200 lines/mm grating |
| Biological Samples / Tissues | 320 nm, 532 nm, 633 nm, 785 nm, 1064 nm (100–200 mW) | Microscope with 50× objective | Edge or Notch filter | High-resolution grating |
| Inorganic Crystals / Materials | 532 nm, 785 nm (50–100 mW) | Microscope (20×–100×) | Edge filter (532 nm) | 1800 lines/mm grating |
| Polymer Analysis | 532 nm, 785 nm (100 mW) | Fiber probe or 20× objective | Edge filter | 1200–1800 lines/mm grating |
| Field or Portable Raman | 785 nm, ~50 mW (battery-powered) | Fiber-optic probe | Compact edge filter | Mini spectrometer with fixed grating |
| Forensic Analysis | 785 nm or 1064 nm | Microscope or probe | Notch filter | Tunable grating |
| Art / Cultural Heritage | 1064 nm, ≤50 mW | Microscope (non-contact) | Notch filter | 1200 lines/mm grating |
| Semiconductor / Thin Films | 320 nm, 532 nm (25–50 mW) | Microscope (100× objective) | Edge filter (532 nm) | High-res grating (≥1800 lines/mm) |
| Education / Training Kits | 785 nm, ≤30 mW | Basic probe or lens | Edge filter | Simple fixed grating |
Frequently Asked Questions -
Q1. What is the most popular laser wavelength for Raman spectroscopy?
The 785 nm NIR laser is the most widely used across industries. It offers an excellent balance of low fluorescence background, affordable detector compatibility (standard CCD), and sufficient Raman scattering intensity for the majority of pharmaceutical, polymer, and biomaterial applications.
Q2. What is the difference between an edge filter and a notch filter in Raman spectroscopy?
An edge filter (long-pass) blocks the Rayleigh line on one side, allowing only Stokes-shifted Raman photons through suitable for most applications. A notch filter blocks a narrow band around the laser wavelength, allowing both Stokes and Anti-Stokes detection. Choose a notch filter when you need temperature measurements or stress/strain analysis via Anti-Stokes intensity ratios.
Q3. CCD or InGaAs - which Raman detector should I choose?
If you use a visible laser (532–785 nm), a CCD (especially back-thinned or deep-depletion type) gives excellent quantum efficiency at lower cost. If you use a 1064 nm laser to suppress fluorescence in biological or organic samples, you need an InGaAs array detector, as CCD sensitivity drops sharply beyond ~1000 nm.
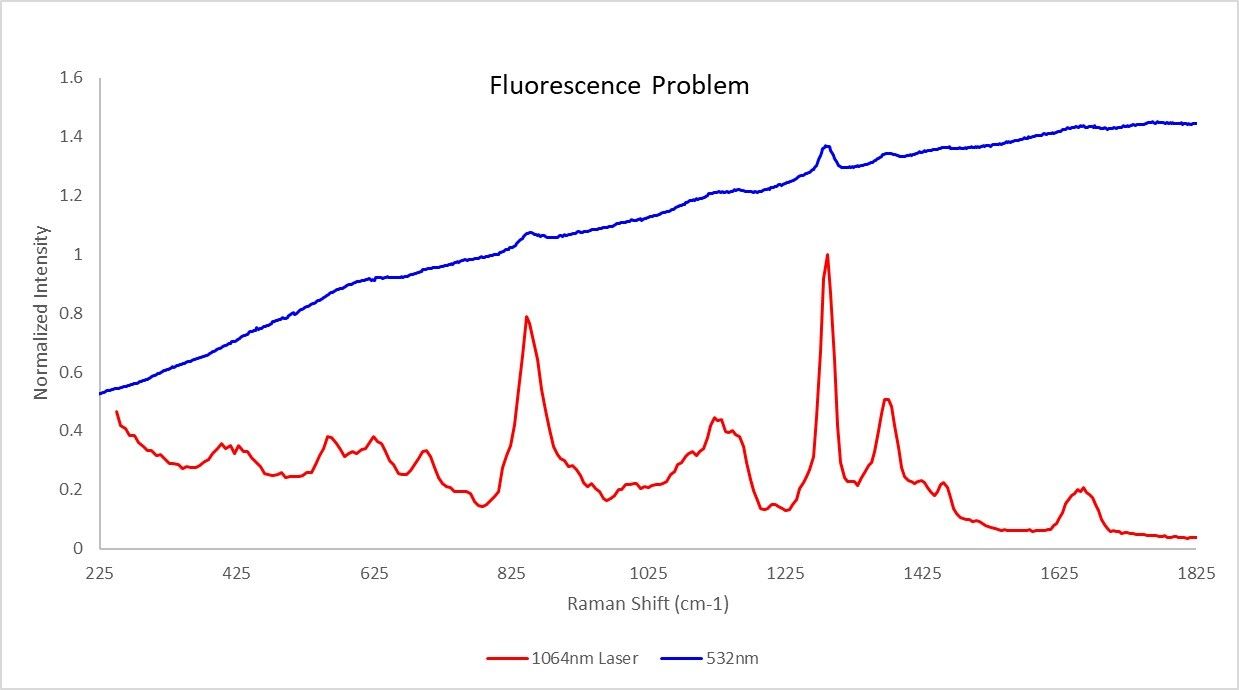
Q4. How do I reduce fluorescence interference in my Raman spectra?
Three strategies work effectively: (1) Switch to a longer excitation wavelength - 785 nm or 1064 nm suppress fluorescence compared to 532 nm. (2) Use photobleaching - pre-illuminate the sample to quench fluorescent species. (3) Apply computational baseline correction in post-processing using tools like PyMCR or MATLAB Raman Toolbox.
Q5. What is the best Raman spectrometer configuration for pharmaceutical quality control?
For pharmaceutical QC, the recommended setup is: 785 nm laser (50–100 mW), edge filter, 1200 lines/mm grating, thermoelectrically cooled CCD detector, and a fibre-optic probe for non-destructive, through-packaging testing. The IndiRAM Portable and Handheld models from TechnoS Photonics are purpose-built for this workflow.
Q6. Can I build a custom Raman spectrometer from individual components?
Yes - modular Raman systems are commercially available and allow precise selection of each component. However, ensure optical alignment compatibility between the laser, probe/objective, filter, grating, and detector. Commercial integrated systems (like the IndiRAM series) remove alignment complexity and are preferable in field or industrial environments.
Conclusion - Balancing Performance, Cost, and Complexity
There is no universally best Raman spectrometer - only the right system for a defined application. The 5 components covered in this guide (laser, optics, filter, grating and detector) interact with each other in ways that make holistic selection more important than optimizing any single element.
High-end research systems deliver unmatched resolution and sensitivity, but many industrial and field applications are fully addressed by mid-range or portable configurations. The IndiRAM Handheld and Portable Raman Spectrometers from TechnoS Photonics are designed precisely for this middle ground - lab-grade accuracy in a field-deployable, application-ready form.
Request for Information
Do you have any questions or requests? Use this form to contact our team.